Every business, no matter how big or small, simple or sophisticated, requires regular reports to run. R Studio, especially in its server flavor with option of cron jobs, is eminently capable of producing these. Parametrized reports are thus able to perform the role of a gateway drug and wean the analytic team off their beloved Excel sheets.
In fact, if I was looking for a single feature to convince a die hard Excel user to see the light and give up his VLOOKUP, I would stress out the ease of regular reporting with parametrized reports. It might not be a fancy ML / AI technique that catches the headlines, but it is one of the small things which take the pain out of everyday chores.
This example will demonstrate creating parametrized reports using the well known and much loved Iris dataset.
It will show:
- a R Markdown template, with a single parameter
speciesdefined
- using
knitr::kablefunction and thekableExtrapackage to build a simple table with a calculated summary row and some basic formatting
- a master R script, calling
rmarkdown::renderon the template to build the reports, iterating value of the parameterspeciesover unique values of species from the Iris dataset
The R markdown template in its easiest part needs just two parts:
- YAML header
- a single R chunk
---
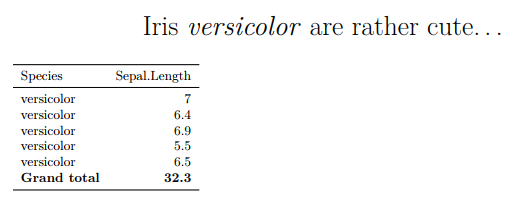
title: "Iris *`r params$species`* are rather cute..." # a report looks better with the title set
params: # this is the parameter declaration
species: "setosa" # default value, overrriden by the render function, but helpful for debugging
output:
pdf_document:
latex_engine: pdflatex
header-includes:
- \usepackage{booktabs}
- \usepackage{longtable}
- \usepackage{array}
- \usepackage{multirow}
- \usepackage[table]{xcolor}
- \usepackage{wrapfig}
- \usepackage{float}
- \usepackage{colortbl}
- \usepackage{pdflscape}
- \usepackage{tabu}
- \usepackage{threeparttable}
- \usepackage[normalem]{ulem}
---The YAML header needs to include declaration of the parameters (indentation is, as is often the case with YAML, crucial). Including a default value is optional, but helpful in debugging.
The header-includes option loads LaTeX macros necessary for table formatting; this list, helpfuly provided by Hao Zhu (the author of kableExtra package) should keep the dreaded LaTeX error “environment xyz undefined” at bay.
library(tidyverse)
library(knitr)
library(kableExtra)

src <- iris %>% # here you would normally load a file or connect to a database...
  filter(Species == params$species) %>%
  mutate(Species = as.character(Species)) %>% # factor would be a problem for summary row
  select(Species, Sepal.Length) %>% # just two columns for the sake of clarity...
  slice(1:5) # first five rows only, so that page space is not an issue

src <- rbind(src, # add summary row
             c("Grand total", sum(src$Sepal.Length)))

kable(src,
      format = 'latex',
      booktabs = T,
      align = c('l','r')) %>%
      row_spec(nrow(src), bold = T) # make the last (summary) row bold
The body chunk needs to:
- declare your libraries (note that
knitr, wherekablelives, is not a formal part of tidyverse - it is ‘just’ suggested - and needs to be loaded separately)
- load your data (I have cheated a little, and used a pre-loaded Iris dataset) and
- peform necessary filtering / aggregating
Note how params$species is applied as filter condition, and how the summary row is created by binding a new row to the filtered dataset.
The master script needs to do two things:
- construct a vector of unique Iris species, each of which will be passed as a parameter the
renderfunction to generate a report - call the
renderfunction fromrmarkdownpackage, with a list of parameters as required by the template. In this simple case just a sigle parameter ‘species’.
library(rmarkdown)

flowers <- unique(iris$Species) # setosa, versicolor, virginica - you know them all, don't you?

for (i in seq_along(flowers)) {
  myIris <- flowers[i]  # my species - to be reused as 1) parameter & 2) file name
  render("report-template.Rmd", # the template
          params = list(species = myIris), # value of myIris passed to the species parameter
          output_file = paste(myIris, '.pdf', sep = ''), # name of the output file - species name and pdf extension
          quiet = T,
          encoding = 'UTF-8')
}
You can download a working example of both the markdown document and master script directly from my pages.
As a next step I recommend learning more about the cronR package - when teamed with the parametric report functionality you get a report that makes itself; an business analyst dream!