I am a great fan of R package tmap. In my personal opinion it is the most effective tool to visualize and communicate spatial data analysis in R context.
I had one issue with it though - I struggled with titles. The package is set up in a way that the map title can overlap with the map itself. Most of the times this is not a problem, but sometimes the title can get out of hand - such a as in this (exaggerated) example:
library(magrittr)
library(tmap)
library(sf)

hranice <- st_read(system.file("shape/nc.shp", package = "sf"), quiet = T)

# draw an ugly chart
tm_shape(hranice) + tm_polygons(col = "red") +
  tm_layout(title = "A Big, Fat Title...", frame = T, title.size = 5)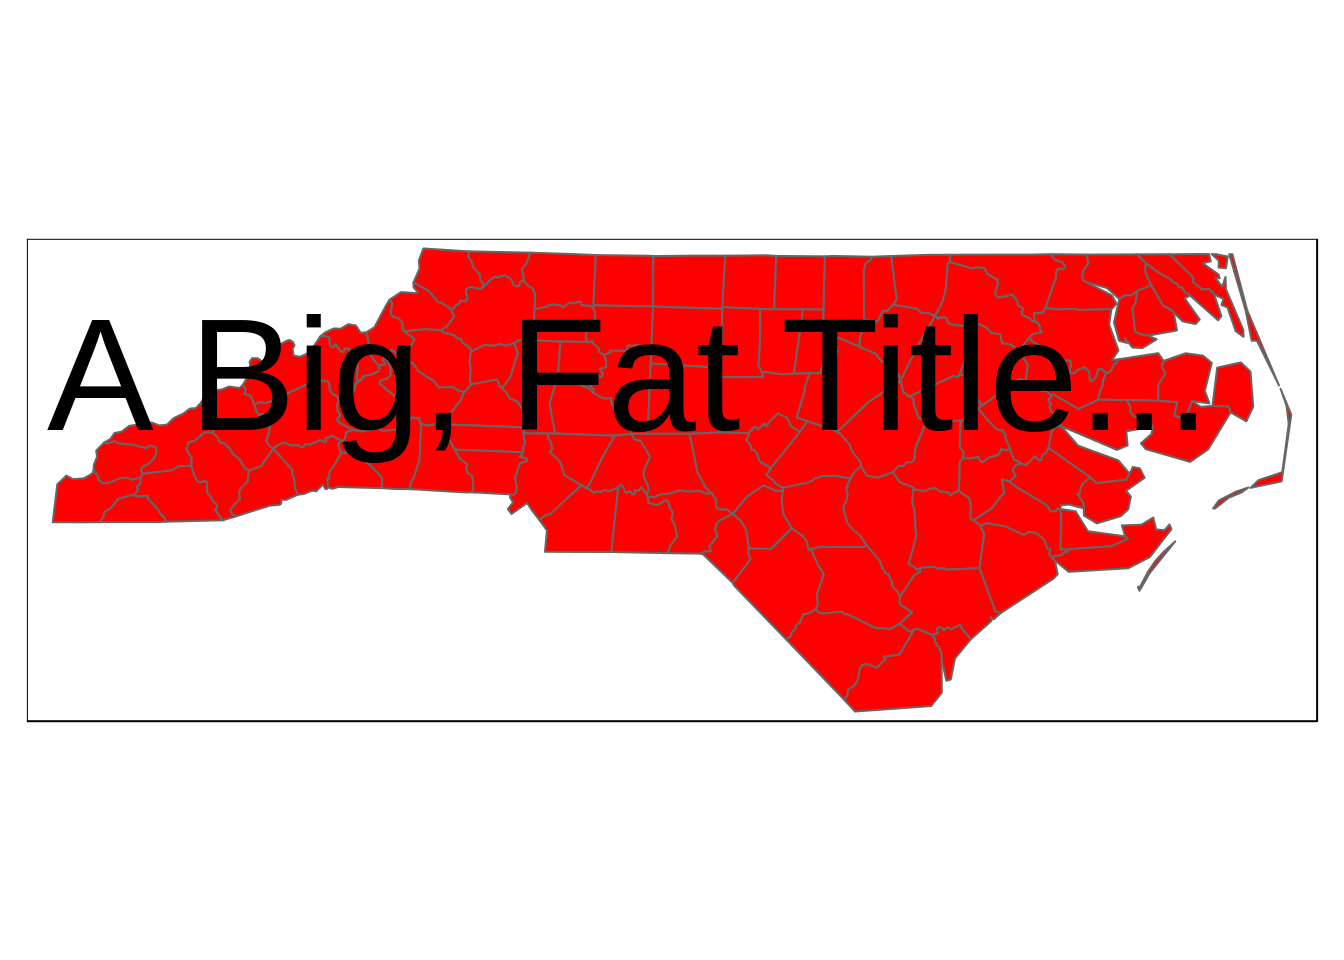
The solution to this problem is using the bbox parameter of the tmap::tm_shape() call.
In the following example I first store the bounding box of the NC map, then extend it by 50% in the northerly direction and finally convert it into a sf polygon to be used as a boudning box of the tmap::tm_shape() call.
bbox_new <- st_bbox(hranice) # current bounding box

xrange <- bbox_new$xmax - bbox_new$xmin # range of x values
yrange <- bbox_new$ymax - bbox_new$ymin # range of y values

# bbox_new[1] <- bbox_new[1] - (0.5 * xrange) # xmin - left
# bbox_new[3] <- bbox_new[3] + (0.5 * xrange) # xmax - right
# bbox_new[2] <- bbox_new[2] - (0.5 * yrange) # ymin - bottom
  bbox_new[4] <- bbox_new[4] + (0.5 * yrange) # ymax - top

bbox_new <- bbox_new %>%  # take the bounding box ...
  st_as_sfc() # ... and make it a sf polygon

# draw a prettier chart
tm_shape(hranice, bbox = bbox_new) + tm_polygons(col = "red") +
  tm_layout(title = "A Big, Fat Title...", frame = T, title.size = 5)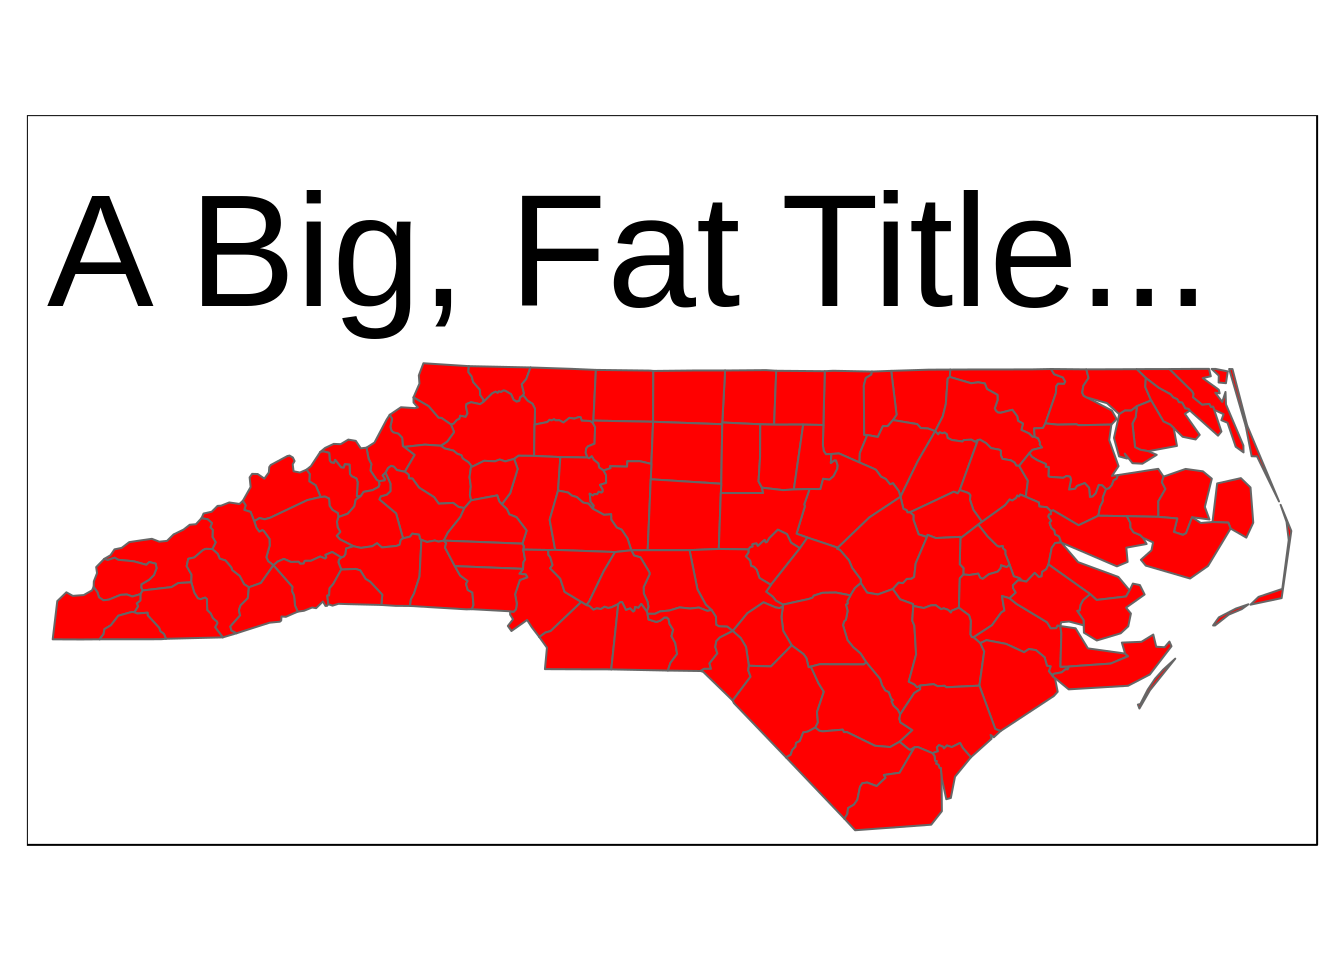
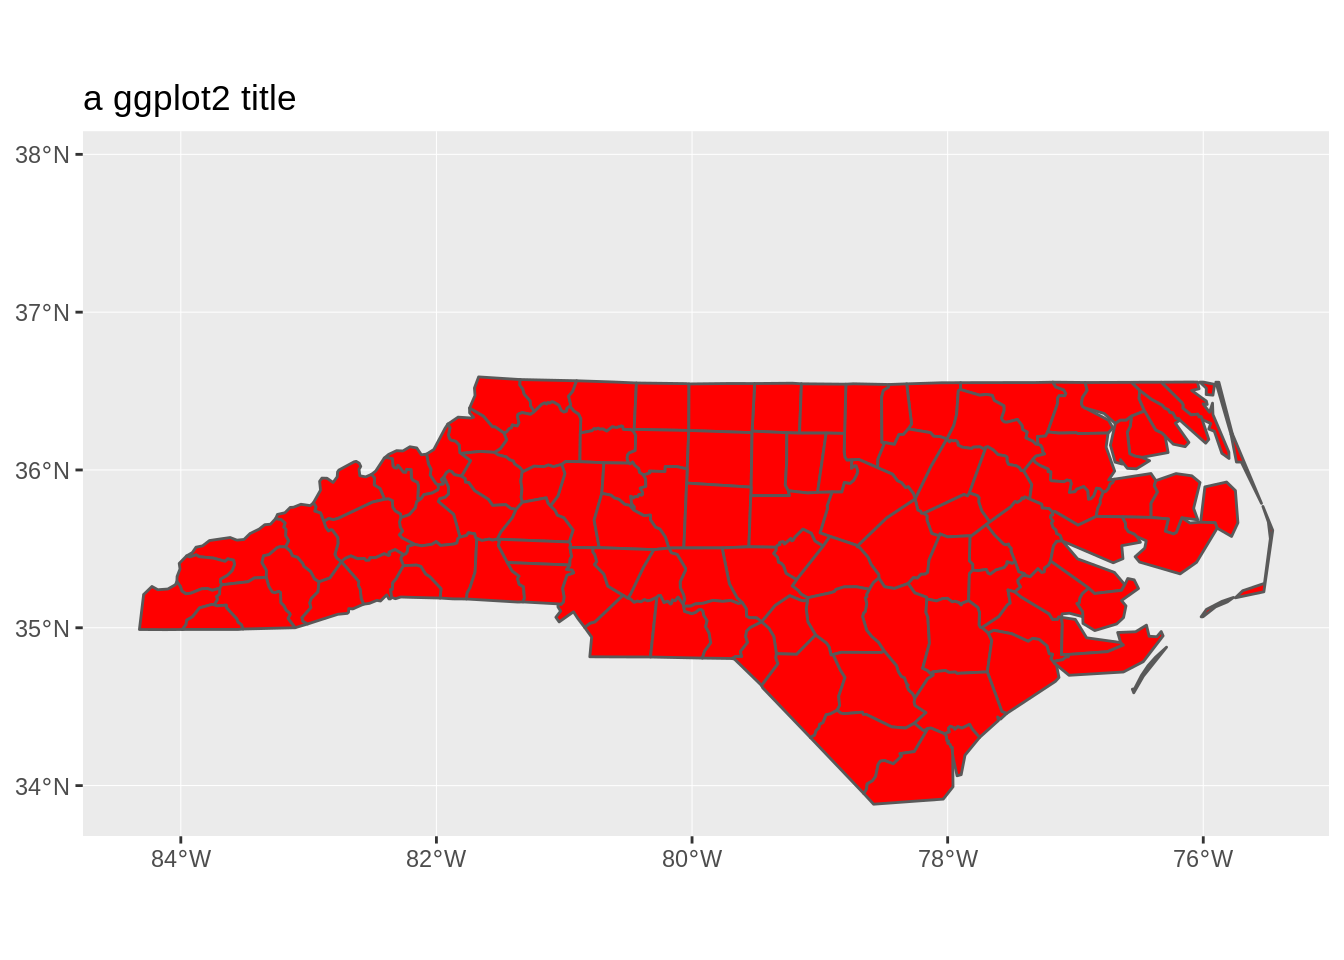
While maps drawn via the ggplot2 package do not suffer from the same problem - the title is drawn outside of the plot area, for better or worse - their bounding box can be also manipulated.
To do so it is necessary to use the xlim and ylim parameters of the ggplot2::coords_sf() call, as demonstrated by the following example:
library(ggplot2)

ggplot(hranice) +
  geom_sf( fill = 'red') +
  coord_sf(xlim = st_coordinates(bbox_new)[c(1,2),1], # min & max of x values
           ylim = st_coordinates(bbox_new)[c(2,3),2]) + # min & max of y values
  ggtitle('a ggplot2 title')